
H3. Runoff and Infiltration
Instructional Objectives
The learner should be able to learn the following by the end of this lesson:
-
the significance of infiltration and runoff in the hydrologic cycle.
-
What is the distinction between the components of overland flow, interflow, and base flow that generate stream flow.
-
Describe hydrographs and hyetographs.
-
Techniques for separating infiltration from effective rainfall using hyetographs.
-
How to determine the Direct Runoff Hydrograph by separating base flow from stream hydrograph
Introduction
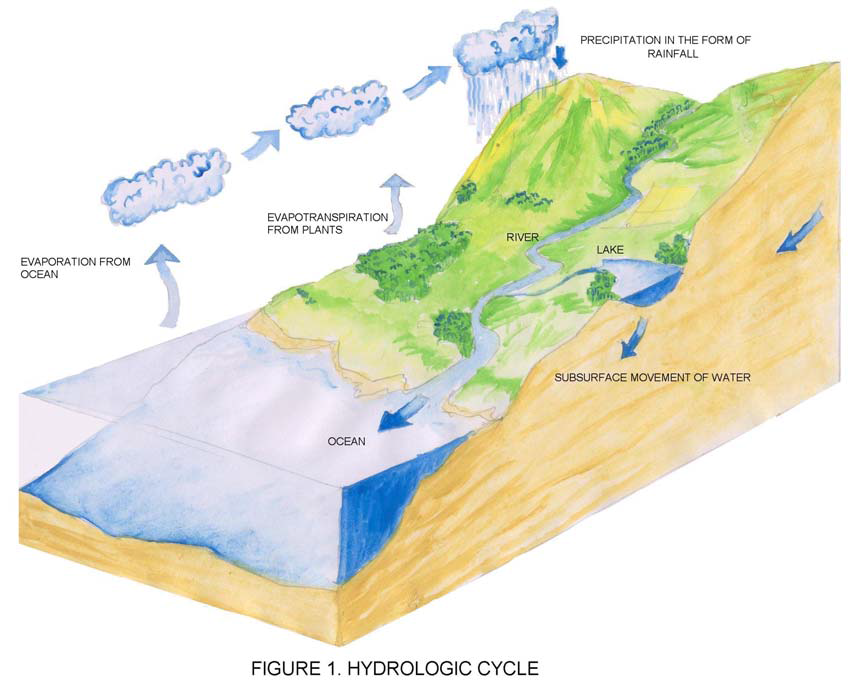
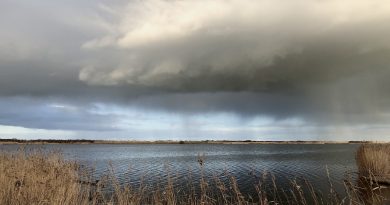
The amount of precipitation flowing over the land surface and the evapotranspiration losses from land and water bodies were discussed in Lesson 2.1. This water is ultimately returned to the sea through various overland or below ground routes. Evaporation from the ocean, which is actually a large water body, contributes to the bulk of water vapor in the atmosphere, driven by the sun’s energy. This process completes the hydrologic cycle (Figure 1), which keeps the water content of the Earth in a continuous dynamic state.
This lesson explores the fate of raindrops as they fall, flow down land, meet streams, and infiltrate soil, contributing to groundwater reserves.
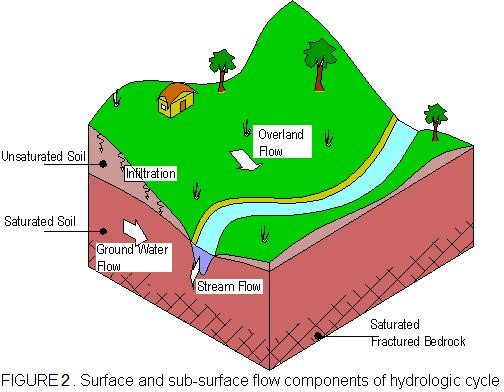
1. Overland flow and interflow
Rainfall during a precipitation event is intercepted by vegetation, known as interception. Without vegetation, rain directly touches the land surface, infiltrating into soils and forming depression storage. If soil is dry, most water infiltrates into the ground. Overland flow occurs when excess rainfall flows over the ground surface. Infiltrated water moves through unsaturated soil in a vertical direction until it meets the water table. Interflow occurs when water in the vadose zone moves laterally and emerges at the soil surface.
Please be aware of the term’s definition Hydraulic conductivity:
Hydraulic conductivity measures a fluid’s flow through a porous medium, influenced by pore size, shape, interconnection, and viscosity. It is expressed as the volume of fluid moving under a gradient.
2. Streamflow and groundwater flow
Most infiltrated water percolates vertically if the unsaturated zone of the soil is consistently porous. The water table rises when infiltrated water enters the groundwater reserve. As a result, there is a difference in potential, and the slope of the water table determines the piezometric head‘s fluctuation in the horizontal direction. The groundwater is forced by the energy differential from the higher to the lower head, and some of it eventually flows into the valley’s stream. In perennial streams, this portion of the streamflow is referred to as Baseflow and is typically the source of dry-weather flow.
The majority of the initial flow of the stream is contributed by overland flow during a storm event. But the sum of the baseflow, interflow, and overland flow determines the stream’s overall flow. It is important to keep in mind that the rates at which these three runoff components move vary greatly. The order of movement is streamflow moving first, then interflow, and last groundwater flow, which may take months or even years to reach the stream.
Some streams have a low water table, causing water loss from the river bed into the ground and reaching the water table, possibly due to natural conditions, dry climate, or heavy pumping.
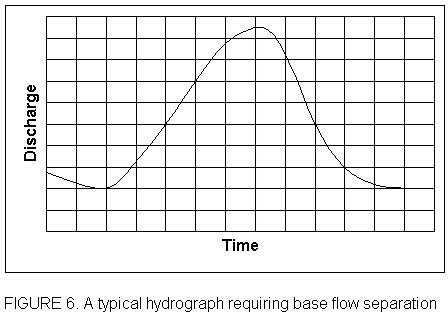
3. The hydrograph and hyetograph
A hydrograph plots streamflow over time, separating groundwater flow for analysis. Overland, interflow, and groundwater flow contribute to the flow, but only groundwater flow is useful.
Lesson 2.1 discusses precipitation and the hyetograph, a graphical plot of rainfall against time. It requires knowledge of geology and surface slope to split a streamflow hydrograph into components.
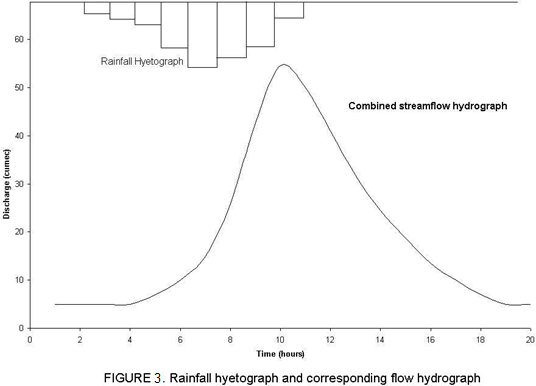
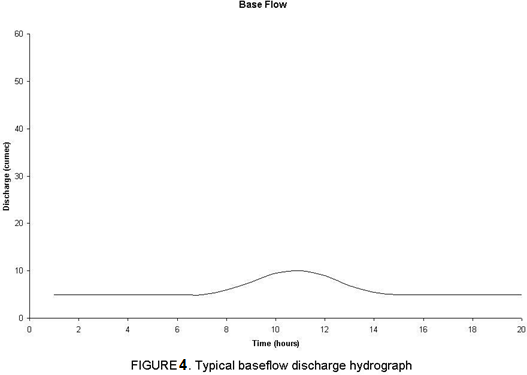
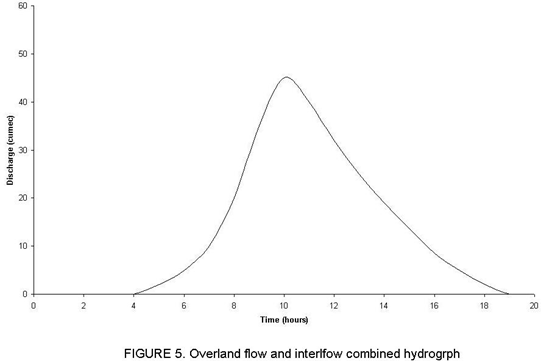
The base flow (Figure 4) and the overland flow added to the interflow (Figure 5) are two components of the combined hydrograph that can be separated.
4. Effective rainfall
Effective rainfall is a portion of total rainfall recorded over a catchment, causing perceptible change in stream flow. Infiltration capacity varies between soils and in its moist and dry states. If the precipitation is lower than the soil’s infiltration capacity, overland flow is not present. As rainfall persists, soil becomes moist, and infiltration rate decreases, causing surface runoff. Mathematical representation and methods for finding effective rainfall are discussed later.
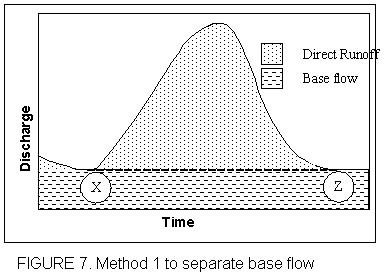
5. Methods of base flow separation
The total runoff hydrograph in Figure 3 shows a stream’s flow rising at 4 hours, peaking at 10.5 hours, and direct runoff ending at 19.5 hours. The base flow and direct runoff are separate, but procedures are explained to separate the two flows. Another hydrograph shows a sudden rise due to a sudden rainfall burst.
Method 1
The base flow and total runoff hydrograph can be separated by joining points X and Z, but this method is considered inaccurate.
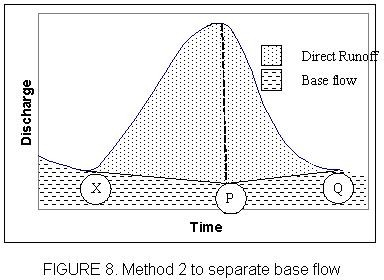
Method 2
The method extends the base flow graph to a point P below the runoff hydrograph peak, drawing a straight line PQ to meet the hydrograph at Q, separated by an empirical relation.
N (in days) = 0.862 A0.2 (1)
Where A is the area of the drainage basin in Km2.
Method 3
The third method utilizes a composite base flow recession curve, as illustrated in Figure 9, with specific points to consider.
Prior to the beginning of the direct runoff hydrograph, X – A follows the trend of the initial base flow recession curve.
The trend of the base flow recession curve at a later stage is followed by B and Q.
B is chosen to be below the hydrograph’s point of inflection (C).
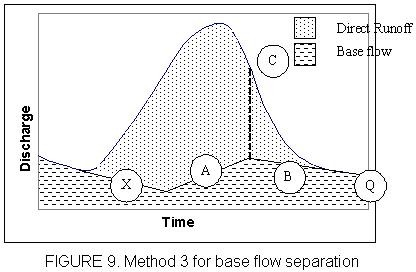
Following separation, the hydrograph yields the base flow in what is called the Direct Runoff Hydrograph.
6. Estimation of infiltration
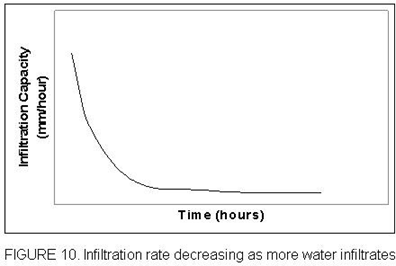
Infiltration capacity refers to the rate at which water infiltrates a ground, with high rates in dry soil and a decaying trend in rain-saturated soil. This is due to the soil becoming moist and eventually reaching a uniform rate.
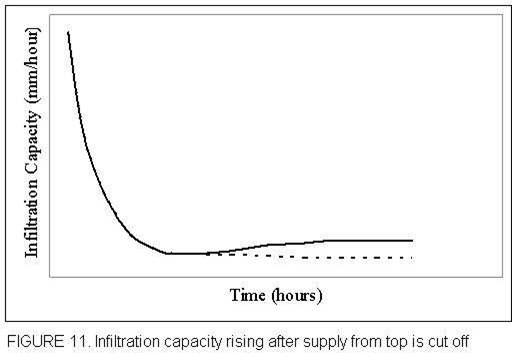
The infiltration capacity increases from the point of discontinuity when the supply of continuous water from the surface is cutoff.
A constant figure of infiltration rate is used for the length of the storm in hydrological calculations. The two types of indices frequently used are detailed in the next section. The infiltration index measures the average infiltration rate.
7. Infiltration indices
The following are the two most widely used infiltration indices:
f – index
W – index
The f – index
According to Figure 12, this is the infiltration rate at which the volume of rainfall matches the amount of runoff.
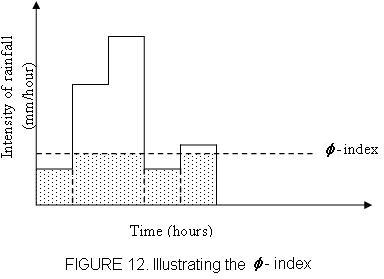
The – index is a measure of infiltration capacity, used for design storms on wet soils. Although criticized for being too simple, it is useful in studying storm runoff from large watersheds. However, in large watersheds, the infiltration process evaluation is less precise, making the – index the only feasible alternative for predicting infiltration.
The W – index
The average infiltration rate is calculated when the rainfall intensity surpasses the infiltration rate.
W is calculated by dividing total infiltration by the time when rainfall intensity exceeds the infiltration rate, resulting in a depth of water.
Total infiltration = Total precipitation – Surface runoff – Effective storm retention
The W- index, derived from rainfall and runoff data, excludes surface storage and retention, and is typically used for large watersheds, unlike the – index.

Thank you a lot for sharing this with all folks you really realize what you’re speaking approximately! Bookmarked. Please additionally discuss with my site =). We may have a link trade contract among us!