H5. Design Flood Estimation
Instructional Objectives
After finishing this lesson, you will understand:
1. How is a design flood for a specific hydraulic structure described?
2. Design floods are selected for: According to the Indian Standard rules, storage dams, barricades, and weirs, diversion works, and coffer dams, and cross drainage works are among the options.
3. How are design floods calculated, namely the hydro-meteorological technique and the statistical approach, respectively?
4. The procedures used by the hydro-meteorological approach, which is typically used for big and intermediate sized dams, to determine design flood.
5. The procedures used to determine design flood using statistical methods, such as probability distributions or the method of visualizing positions.
Introduction
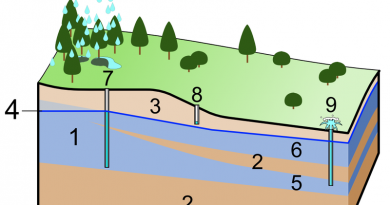
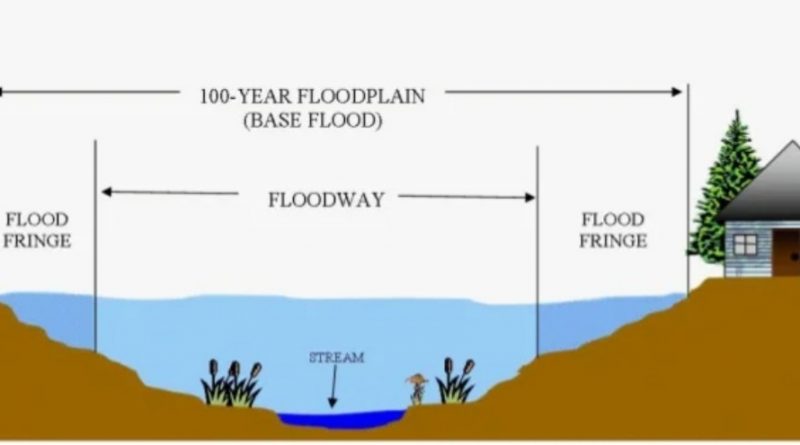
Floods are unusually high levels of a river, often filling the stream and spilling over to flood plains. Hydraulic structures, like dams or barrages, must be designed to prevent collapse and damage. An estimate of extreme flood flow is necessary for hydraulic structure design, with magnitude based on the structure’s importance. Proper selection of design flood value is crucial, as higher values increase hydraulic structure costs but underestimation may put the structure and population at risk.
1 Defining the design flood
Another approach to describe the Design Flood for a hydraulic structure is as follows:
• The highest flood that a structure can safely withstand.
• The flood taken into account for a structure’s design in accordance with a maximum bearable risk.
• The amount of flooding that a project (including a hydraulic structure) can withstand without seriously harming the things it protects or its own structures.
• The biggest flood that could be used to assess the safety of a structure.
The Inflow Design Flood (IDF) is another name for Design Flood. It is the flood that was used in design and might be:
• The whole flood hydrograph, or the range of discharge values that can exist over time.
• The flood hydrograph’s peak discharge.
2 Choice of design flood
According to the Bureau of Indian standard guidelines IS: 5477 (Part IV), the Inflow Design Flood (IDF) of a structure may be selected from one of the following, based on its significance or level of risk:
• Probable Maximum Flood (PMF):
Floods in a region are caused by severe meteorological and hydrological conditions, calculated using the Probable Maximum Storm (PMS), which estimates the physical upper limit of storm rainfall.
• Standard Project Flood (SPF):
The SPF is the flood resulting from the most severe meteorological and hydrological conditions in a region, calculated from the Standard Project Storm over the watershed, not maximized for critical conditions.
• Flood of a specific return period:
Frequency analysis of annual flood values is used to estimate design floods, which typically have a return period longer than the storm.
The IDFs for various river-constructed structures vary, with some being crucial for water resources engineering:
• Storage Dams.
• Barrages and Weirs
• Diversion Works and Coffer dams
• Cross drainage works
A brief description of the structures and their corresponding IDF’s are discussed subsequently.
3 Design flood for storage dams
Dams are hydraulic structures designed to store water, with some inflow floods stored and excess overflowing through spillways. The Indian Standard guidelines IS: 11223-1985 guide the IDF for various requirements.
3.1 IDF for the safety of the dam
Standard specifications ensure dam performance against overtopping, structural failures, and reasonable functioning of spillway and energy dissipation arrangement for lower floods.
• IDF should be based on PMF for major dams, which are those with gross storage higher than 60 million m3 or hydraulic head greater than 30 m.
• IDF should be based on SPF for intermediate dams (gross storage between 10 and 60 million m3 or hydraulic head between 12 m and 30 m).
• For modest dams (gross storage between 0.5 and 10 million m3 or hydraulic head between 7.5 and 12 m), the IDF may be interpreted as a flood that will occur 100 years in the future.
Floods of varying magnitudes can be utilized if the potential failure hazard is high or low, considering factors beyond the size:
• The downstream channel’s maximum hydraulic capacity at a level where catastrophic damage is not anticipated; and • The distance to and placement of the human habitations on the downstream after taking into account the predicted future developments.
3.2 IDF for efficient operation of energy dissipation system
The flood, potentially lower than the IDF, ensures dam safety and optimal energy dissipation when used with standard specifications or performance factors.
3.3 IDF for checking extent of upstream submergence
The submergence effects of structures like power houses and mines can be determined using SPF or PMF levels, while smaller design floods and levels attained may suffice for other structures.
3.4 IDF for checking extent of downstream damage in the valley
The decision to flood a property depends on local conditions, property type, and submergence effects. For important facilities, outflows corresponding to flood design may be necessary for safety.
4 Design flood for barrages and weirs
Weirs and barrages are diversion structures with typically minimal storage capacities, and failure of the structure would hardly ever increase the risk of loss of life or property. In addition to causing structural damage or loss, the breakdown would interfere with irrigation and communications that rely on the barrage. The following is advised in accordance with Bureau of Indian Standard guidelines IS: 6966(Part-I) – 1989, “Hydraulic design of barrages and weirs-guidelines for alluvial reaches”.
• Flood for free board design using SPF or a 500-year return period
• A 50-year deluge of returns for anything other than free boards.
5 Design flood for diversion works and coffer dam
Coffer dams are temporary structures used to obstruct river flow before constructing hydraulic structures like dams or barrages. The Bureau of Indian Standards recommends designing them for floods with a frequency less than the main structure’s design. Seasonal cofferdams and those with multiple seasons can have a flood frequency of 20 years or more. Advanced construction stages may require a 100-year flood frequency.
6 Flood for cross drainage works
Cross drainage works are essential in irrigation canal networks, where canals must cross local streams and rivers. These structures, either conveyed over the stream or passed below through siphon aqueducts, are designed based on the canal’s size, drainage channel’s size, and location. The design flood for these structures should consider the potential damage to long canals and drainage channels:
Category of structure Canal discharge (m3/s) Estimated Drainage discharge Note* (m3/s) Frequency of design flood
A 0 – 0.5 All discharges 1 in 25 years
B 0.5 – 15 0 – 150 1 in 50 years
>150 1 in 100 years
C 15 – 30 0 – 100 1 in 50 years
>100 1 in 100 years
D >30 0 – 150 1 in 100 years
>150 Note **
Notes:
* The discharge estimated based on river parameters corresponding to the highest reported flood level is referred to here.
** In the event of very large cross drainage constructions, where the expected drainage discharge is over 150 m3/s and the estimated canal discharge is larger than 30 m3/s, the hydrology should be thoroughly evaluated and the suitable design flood should be selected, which in no circumstance shall be less than a flood occurring once every 100 years.
7 Methods for design flood computations
The design flood selection criteria for different types of hydraulic structures were examined. Any of the following three techniques are advised for each of these:
• Probable Maximum Flood (PMF)
• Standard Project flood (SPF)
• Flood of a specific return period
The hydrometeorological approach, which makes use of the unit hydrograph theory, governs the procedures for calculating PMF and SPF. Using a statistical method known as flood frequency analysis, flood of a specific frequency (or return period) is obtained. Each technique needs enough information to perform the calculations. Long-term and short-term rainfall and runoff values, yearly flood peaks series, catchment physiographic parameters, etc. are among the data that are needed.
India’s vast areal extent necessitates synthetically generated flood formulae for ungauged catchments. The Central Water Commission, India Meteorological Department, and Indian Railways have classified the country into 7 zones and 26 hydro-meteorologically homogeneous sub-zones, publishing flood estimation guidelines for each region.
The computations used to determine the value of are examined in more detail in the section that follows.
• SPF and PMF using a hydrometeorological method.
• Statistical analysis of a flood of a particular frequency.
8 The hydro-meteorological approach
The hydro-meteorological approach is used to estimate the probable maximum flood (PMF) or standard project flood (SPF), based on the worst possible maximum storm pattern and the worst observed rainfall pattern.
The hydro-meteorological approach estimates the PMS or SPS by analyzing causative factors for severe floods. This involves estimating a design storm hyetograph and deriving a catchment response function, either a lumped model or a distributed-lumped model, where the catchment is divided into sub-regions.
The hydro-meteorological approach’s method for calculating PMF/SPF incorporates the following steps:
• Information needed for PMF/SPF research
• Procedures for assessing PMF/SPF
• PMF/SPF estimates have limitations
The supplementary section 12 at the end of this course goes into great detail about each of these.
9 The statistical approach
Flood frequency analysis is a statistical method used for design flood estimation, based on past recorded data of annual flood peak discharges or rainfall events. It predicts future probabilities of flood occurrence and estimates the magnitude of events corresponding to a specific return period. For large return periods, extrapolation outside the observed range of data is often necessary. Water resources engineers may need to project more than twice the length of the record for reasonable accuracy.
10 Calculations for flood frequency
Flood frequency analysis involves a population of data, including annual maximum floods occurring at a river site. The data is assumed to be representative of the population and independent of each other. The analysis starts by checking the consistency of the data and identifying features such as trends and jumps. The probability distribution curve is applied to fit the data set, where each data variable is represented by a variable called ‘x’. The probability of a variable is defined as the number of occurrences of a variable divided by the total number of occurrences, usually designated by ‘P’. The cumulative probability curve, F(x), represents the probability that the random variable has a value equal to or less than a specific assigned value. In flood frequency analysis, the probability of a high flood peak is determined by calculating the probability with which it is likely to occur. There are several probability distributions, such as Normal, Log-normal, Pearson Type III, and Gumbel, which are tested using standard statistical tests.
11 Plotting positions
The ‘plotting position’ method is used to assign probability to a data point in a sample data. The data is arranged in decreasing order, with each data point given a rank’m’. The probability of exceedence of a certain value x is given differently by different researchers, with the Weibull formula being most commonly used. An example of applying the plotting position method is given for yearly peak flood flows of a hypothetical river from 1981 to 2000. The data is rearranged according to decreasing magnitude, designating a plotting position, and calculating the probability of exceedence using the Weibull formula. This method also gives the Return Period T (1/P) and the probability of the flood peak flow.
12 Additional information and definition of important terms
Free board
The free board is the minimal space provided above the maximum reservoir level to prevent the danger of water overflowing the dam.
Hydro- meteorologically homogeneous sub-zones
This suggests that the country has been divided into regions with comparable hydrological and meteorological characteristics. There are 26 sub-zones in the entire nation. The Central Water Commission (CWC), Research Designs and Standards Organization (RDSO), and India Meteorological Department (IMD) have collaborated on this.
Channel routing
Each sub-catchment’s outlet is situated many kilometers upstream from the main catchment’s outlet. A sub-catchment’s outflow will go through the channels before arriving at the catchment outlet. In order to determine the flow at the catchment outlet through a technique known as channel routing, it is important to estimate the outflow hydrograph of the channel since the inflow hydrograph to a channel will change as a result of the temporary storage of the channel.
Reservoir routing
When a flood enters a reservoir, its hydrograph will vary as it leaves the reservoir. This is caused by the volume of water temporarily kept in the reservoir. The hydrograph’s peak will be lower, the time to peak will be later, and the hydrograph’s base will be higher. Reservoir routing is the technique of calculating how much an inflow hydrograph will be altered within the reservoir.
Data requirement for PMF/SPF studies
1. Watershed data
• The entire watershed region, the amount of snow-covered land, the minimum and maximum altitudes above mean sea level, and the length of the river up to the project site; • Lag time, reach travel times, and concentration time;
Land use patterns, soil types, surface and subsurface divisions, contributing areas, mean overland flow distances, slopes, design storm water losses, evaporation, infiltration, depression and interception losses, and infiltration capacities
2. Channel data
• Manning’s n or the information needed to estimate channel roughness coefficient; • Channel and valley cross sections at various locations taken into consideration to fix the gauge discharge rating curves.
3. Runoff data
• Base flow projections for planned floods.
• If available, historical information on floods as well as precipitation data, including information from self-recording rain gauges.
4. Storm data
• Daily rainfall data from each rain gauge station within and surrounding the research area
• Self-recording rain gauge rainfall data
• Information on maximum dew point temperatures and storm dew points
Steps for evaluating PMF/SPF
1. Estimate duration of design storm
It is deemed sufficient for the duration of the design storm to be the base period of the unit hydrograph, rounded to the nearest 24 hours and less than or equal to 72 hours. for big
catchments, the storm duration required to produce the PMF is 2.5 times the distance traveled from the time of concentration to the location of the building.
2. Selection of design storm
A design storm is a forecast of the volume and distribution of rainfall over a specific drainage area that is used to calculate the design flood. This might either be the Standard Project Storm (SPS) or the Probable Maximum Storm (PMF).
3. Time adjustment of design storm and its critical sequencing
Two bells (peak) every day should be used to arrange the design hyetograph. The maximal flood-producing qualities will be represented by the arrangement of the bells and the placement of the rainfall increments within each bell-shaped spell.
The crucial placement of each bell’s increment should maximize the flood peak while minimizing any abrupt hills or sluggishness. Therefore, the arrangement must be made so that the gap between the peak intensities of two spells is as short as possible. The natural mass curve pattern as seen by a Self Recording Rain gauge (SRRG) of the project region should be reflected in the cumulative pattern of all the increments in the order of their positioning.
4. Estimate the design Unit Hydrograph
Any of the following methods may be used to generate the unit hydrograph depending on the data’s availability, the flood hydrograph’s properties, etc.
o Easy way to derive a unit hydrograph from a flood event with a single peak
o Collin’s method
o Clarke model
o Nash method.
If there aren’t enough data, a synthetic unit hydrograph can be created.
5. Calculating the probable maximum flood hydrograph
When the base flow is included, the direct hydrograph—which is obtained by superimposing the crucial time sequence of the design storm rainfall on the derived design unit hydrograph—gives the probable maximum flood hydrograph. In Lecture 2.4, these calculations are explained in more detail.
Limitation of PMF/SPF calculations
• Long-term hydrometeorological data are necessary for estimating design storm parameters.
• Physical modeling of rainfall to compute PMP has not yet been undertaken since the understanding of the rainfall mechanism as it is currently understood has serious limits.
• Based on surface dew point data, previous storms are currently maximized for potential maximum favorable conditions. Data on the dew point at the surface could not accurately reflect the amount of moisture in the upper atmosphere.
• The availability of self-recording rain gauge (SRRG) data for previous storms (keep in mind that SRRG data shows how rain falls over time).
• A lot of the unit hydrograph theory’s presumptions aren’t met in reality.
• It happens frequently that sufficient quantities and high-quality data are not available for the creation of unit hydrographs.
Lag Time
The interval between the peak flow and the center of rainfall is known as the lag.
Travel time
The amount of time it takes for water to travel from one basin point to another is referred to as the journey time.
Evaporation
Evaporation is the term for the moisture extraction process.
Infiltration
The gradual movement of a liquid through a filtering material is known as infiltration.
Interception
The act of intercepting precipitation by trees or structures prevents it from reaching the ground.
Base flow
The component of a stream’s discharge known as base flow comes from natural storage, such as groundwater outflow, the draining of sizable lakes and swamps, or some source other than net rainfall that generates surface runoff.
Base period
Base period refers to the length of time between a crop’s first watering at the time of sowing and last watering just before harvest. Always, base period is shorter than crop period.
Unit hydrograph
A unit hydrograph is the runoff hydrograph caused by an excess of 1 cm of rain that falls evenly throughout the whole drainage basin at a constant rate for the full time period indicated.
Time of concentration
A drainage basin’s period of concentration is the amount of time the water needs to travel from its furthest point to its outflow.